 (3)")
For many small business owners, the Profit and Loss (P&L) statement often gets overlooked or misunderstood. In reality, not enough owners know how to read or leverage this essential report.
Your P&L isn’t just a list of numbers. It’s actually a valuable tool that reveals the true state of your business’s finances. Regularly reviewing and understanding this report allows you to spot patterns, monitor performance, and make adjustments that support your business’s growth and goals.
Let’s break down each section of the P&L and explore how you can use it to drive your business forward.
What is a Profit and Loss Statement?
A profit and loss statement, also known as an income statement, is a financial report summarising the revenues, costs, and expenses incurred during a specific period, usually a financial quarter or year. It provides a clear snapshot of your company’s operational performance by showing how revenue is transformed into net income or net profit.
Key Components of a P&L Statement
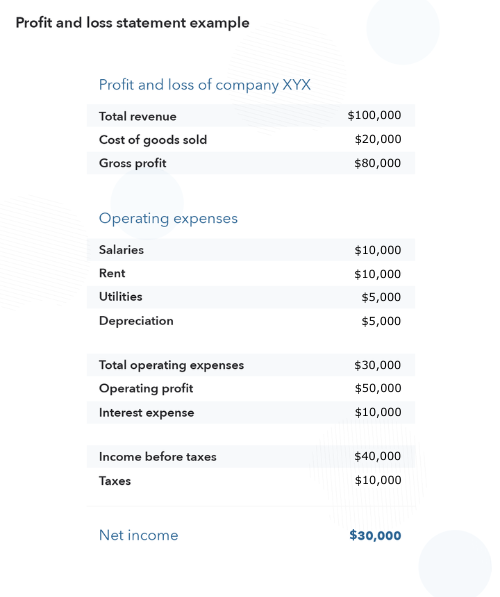
1. Revenue
This is the starting line of the P&L statement. Revenue includes all income received from your business activities, such as sales of products or services. It’s important to differentiate between gross revenue (total sales) and net revenue (gross sales minus returns, discounts, and allowances).
2. Cost of Goods Sold (COGS)
COGS represents the direct costs attributable to the production of the goods sold by your company. This includes materials and labour costs directly tied to service delivery or product manufacturing. Subtracting COGS from net revenue gives you the gross profit.
3. Operating Expenses
These are the costs related to running the business that are not directly linked to product creation or service delivery. Operating expenses include items like rent, utilities, marketing, and employee salaries (not included in COGS). Breaking these down helps identify areas to cut costs or invest more.
4. Operating Profit
Also known as Earnings Before Interest and Taxes (EBIT), operating profit is calculated by deducting operating expenses from gross profit. This figure indicates the efficiency of your business operations.
5. Interest and Taxes
Interest expense arises from any borrowed funds, while tax expense is based on the operating profit. These are critical figures as they impact the final profit numbers. It’s important to note that only the interest component of loan repayments is deductible and recorded in the P&L, while the capital component reduces the loan liability in the balance sheet. Properly splitting the interest and capital ensures accurate financial reporting and compliance with tax regulations.
6. Net Profit
The bottom line of the P&L statement shows the net profit, which is derived after subtracting interest and taxes from the operating profit. This number tells you how much your business actually earned or lost during the period.
Analysing Your P&L Statement
To get the most out of your P&L statement, you’ll want to go beyond just looking at the numbers for a single period. Start by comparing the data over several periods—quarterly or annually—to spot trends and shifts in your business performance over time.
- Revenue Trends: Is your revenue increasing, decreasing, or staying flat? Regularly tracking your revenue gives you insights into the overall growth of your business and helps you pinpoint whether external factors or business changes are affecting your sales.
- Cost Management: Look at how your costs, including expenses like materials, labour, and overhead, are changing over time. If your costs rise faster than your revenue, it might be time to investigate where you can cut back or find efficiencies.
- Profitability Patterns: This is where you’ll dig into your gross profit margin, operating margin, and net profit margin:
- Gross Profit Margin shows how much your business makes after covering the direct costs of producing goods or services. A healthy margin indicates you’re managing production costs well.
- Operating Margin focuses on your profitability after accounting for operating expenses like rent, salaries, and utilities. This margin reveals how efficiently your business is operating.
- Net Profit Margin reflects what’s left after all expenses, including taxes and interest, are taken out. It clearly indicates overall profitability and whether your business is on track to meet financial goals.
By comparing these margins to industry benchmarks, you can see if your business is performing in line with competitors or if there’s room for improvement.
The goal of this analysis is not just to see the numbers but to understand what they’re telling you about your business. This way, you can take actionable steps, whether adjusting pricing, managing expenses, or finding ways to boost revenue.
Strategic Use of P&L Insights: Turning Data Into Action
Here’s how you can strategically use the insights from your P&L to plan for growth and sustainability:
Budgeting and Forecasting
Historical data from your P&L gives you a foundation for forecasting future revenues and expenses.
For example, if your P&L shows a consistent increase in sales during specific months or quarters, you can plan to allocate more resources during those periods. Similarly, if you notice seasonal fluctuations in expenses (like higher energy costs in winter), you can budget accordingly. This approach helps you create more accurate budgets and set realistic financial targets that align with your business’s patterns.
Identifying Growth Opportunities
By analysing the profitability of different products or services, you can identify which areas of your business deliver the highest returns. If your P & L shows that a certain service has consistently higher profit margins, you should direct more marketing or resources to that area to maximise profits. On the other hand, if a product has low margins and high expenses, it might be time to rethink your strategy—either improving efficiency or cutting it altogether.
Cost Control
Your P&L helps you keep an eye on expenses. If you notice unexpected spikes—like higher-than-usual supplier costs or a jump in operating expenses—it’s an opportunity to dig deeper and understand why. For instance, if labour costs are rising, could you optimise workflows to reduce overtime? Or, if utilities have increased, is there a more cost-efficient solution? Trimming excess costs without compromising quality can make a significant difference in your bottom line.
Investment Decisions
The profitability section of your P&L can guide whether it’s the right time to invest in new opportunities like expansion, renovations, or new equipment. For example, if your net profit margin has been steadily improving, it may be a good time to reinvest those profits into growth areas. If margins are tight, you might want to hold off on big investments until the business stabilises financially.
Prepare For the Future
Mastering your P&L statement is critical to staying ahead in business. Think of it as a tool that reflects not only your past financial activities but also shapes your future strategies. At GrowthIQ, our agile CFO and advisory sessions dig deeper into the P&L and its insights to guide decision-making regarding the future direction of your business.
Those taking advantage of this service are able to seize opportunities sooner and maximise their results compared to competitors. By using these insights, you can make better decisions about budgeting, growth, cost control, and investment, ensuring your business thrives in both the short and long term.
Don’t hesitate to get in touch if you need expert advice to fine-tune your financial tactics. Our team is ready to help you understand your financial landscape and ensure your business strategies are spot-on.